US Crude Balance — April 2026
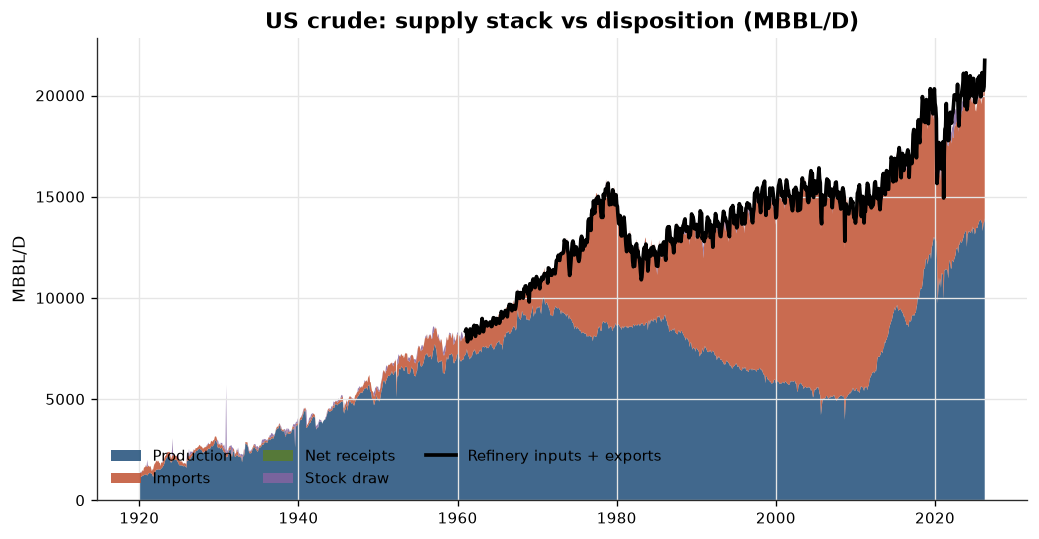
Generated 2026-07-29 16:44 UTC. All flows MBBL/D. Bottom-up balance vs EIA published data.
Source freshness
| source | latest_period | lag_months | last_pulled | expected_cadence | expected_next | status |
|---|---|---|---|---|---|---|
| AER | 2026-04-01 | 3 | 2026-07-06 21:16 | monthly | 2026-05-01 | OK |
| CER | 2026-06-16 | 1 | 2026-07-10 02:28 | monthly | 2026-07-16 | OK |
| CER_TOLLS | 2026-05-01 | 2 | 2026-07-10 16:55 | monthly | 2026-06-01 | OK |
| CNLOPB | 2026-05-01 | 2 | 2026-07-12 16:33 | monthly | 2026-06-01 | OK |
| EIA | 2026-04-01 | 3 | 2026-07-29 14:29 | monthly | 2026-05-01 | LATE |
| EIA_WEEKLY | 2026-06-26 | 1 | 2026-07-06 14:26 | weekly | 2026-07-03 | OK |
| FERC | 2026-01-01 | 6 | 2026-07-16 19:55 | annual | 2027-01-01 | OK |
| NDIC | 2026-04-01 | 3 | 2026-07-06 19:30 | monthly | 2026-05-01 | OK |
| NM_OCD | 2026-05-01 | 2 | 2026-07-06 15:46 | monthly | 2026-06-01 | OK |
| PORTOFCC | 2026-05-01 | 2 | 2026-07-08 21:44 | monthly | 2026-06-01 | OK |
| RRC | 2025-08-01 | 11 | 2026-07-09 23:42 | monthly | 2025-09-01 | OK |
| RRC_T1 | 2025-10-01 | 9 | 2026-07-18 15:30 | monthly | 2025-11-01 | OK |
| SASK_ENERGY | 2026-04-01 | 3 | 2026-07-11 20:55 | monthly | 2026-05-01 | OK |
| STATCAN | 2026-04-01 | 3 | 2026-07-06 20:34 | monthly | 2026-05-01 | OK |
Headlines
- US residual: -762 MBBL/D.
- Exports up 1,550 MBBL/D m/m.
- Stock Draw up 1,362 MBBL/D m/m.
- Imports down 279 MBBL/D m/m.
Balance by region
| Region | production | imports | net_receipts | stock_draw | refinery_inputs | exports | residual | spr_stock_draw | residual_incl_spr | transfers_to_supply | residual_incl_transfers |
|---|---|---|---|---|---|---|---|---|---|---|---|
| US | 13,934 | 6,257 | 0 | 785 | 16,145 | 5,593 | -762 | 677 | -85 | 379 | -383 |
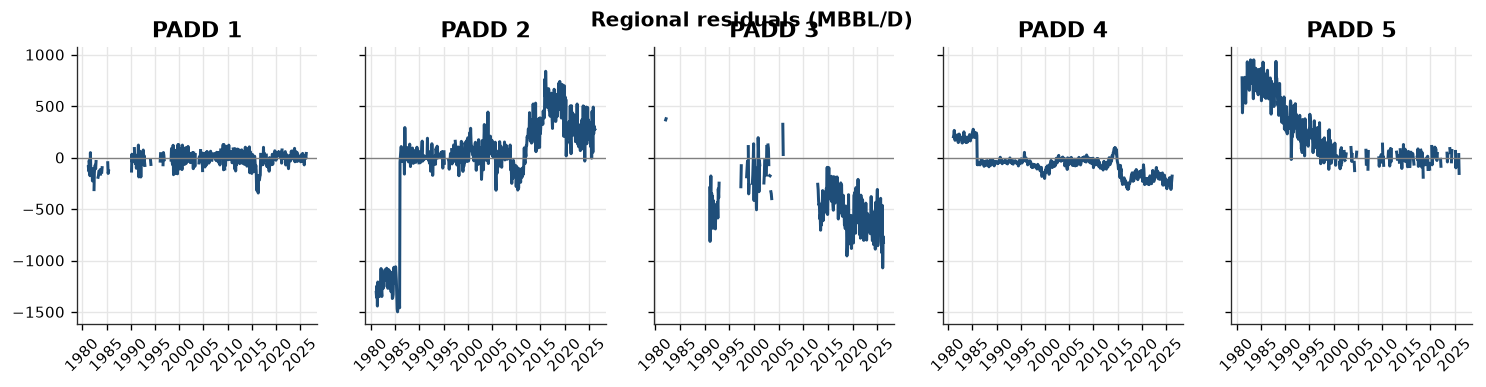
| P1 | 62 | 678 | 133 | -10 | 811 | 11 | 41 | nan | nan | nan | 41 |
| P2 | 1,765 | 3,025 | -890 | 118 | 3,620 | 122 | 276 | nan | nan | nan | 276 |
| P3 | 10,404 | 1,230 | 1,604 | 736 | 9,360 | 5,435 | -821 | nan | nan | nan | -821 |
| P4 | 1,020 | 364 | -1,067 | -22 | 474 | 0 | -180 | nan | nan | nan | -180 |
| P5 | 683 | 960 | 221 | -37 | 1,879 | 25 | -77 | nan | nan | nan | -77 |
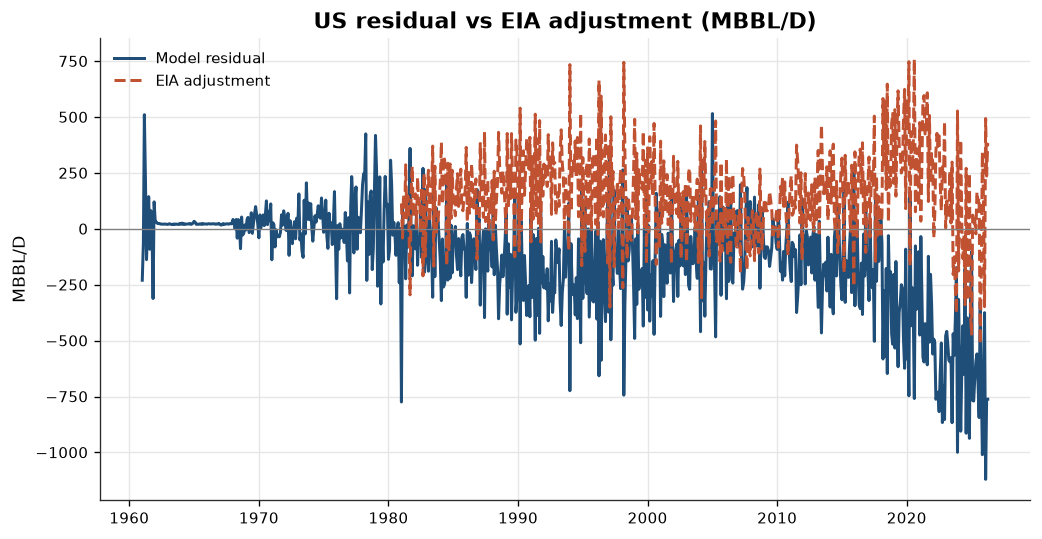
Residual reconciliation vs EIA adjustment (last 12 months)
| period | model_residual | spr_stock_draw | residual_incl_spr | transfers_to_supply | residual_incl_transfers | eia_adjustment | gap | gap_incl_spr | gap_incl_transfers |
|---|---|---|---|---|---|---|---|---|---|
| 2025-05 | -595 | -95 | -690 | 617 | 22 | -22 | -618 | -713 | -1 |
| 2025-06 | -559 | -31 | -591 | 395 | -164 | 165 | -395 | -426 | 0 |
| 2025-07 | -687 | 1 | -686 | 569 | -118 | 116 | -570 | -569 | -1 |
| 2025-08 | -844 | -63 | -907 | 706 | -138 | 138 | -706 | -769 | 0 |
| 2025-09 | -326 | -68 | -394 | 840 | 514 | -514 | -840 | -908 | 0 |
| 2025-10 | -684 | -84 | -768 | 890 | 206 | -205 | -889 | -973 | 1 |
| 2025-11 | -1,010 | -78 | -1,088 | 666 | -344 | 343 | -667 | -745 | -1 |
| 2025-12 | -813 | -50 | -863 | 671 | -142 | 142 | -671 | -720 | 0 |
| 2026-01 | -375 | -56 | -431 | 723 | 348 | -348 | -723 | -780 | -0 |
| 2026-02 | -1,120 | -8 | -1,129 | 628 | -492 | 493 | -627 | -635 | 1 |
| 2026-03 | -762 | 20 | -743 | 527 | -235 | 236 | -526 | -506 | 1 |
| 2026-04 | -762 | 677 | -85 | 379 | -383 | 384 | -378 | 298 | 1 |
Regional residuals
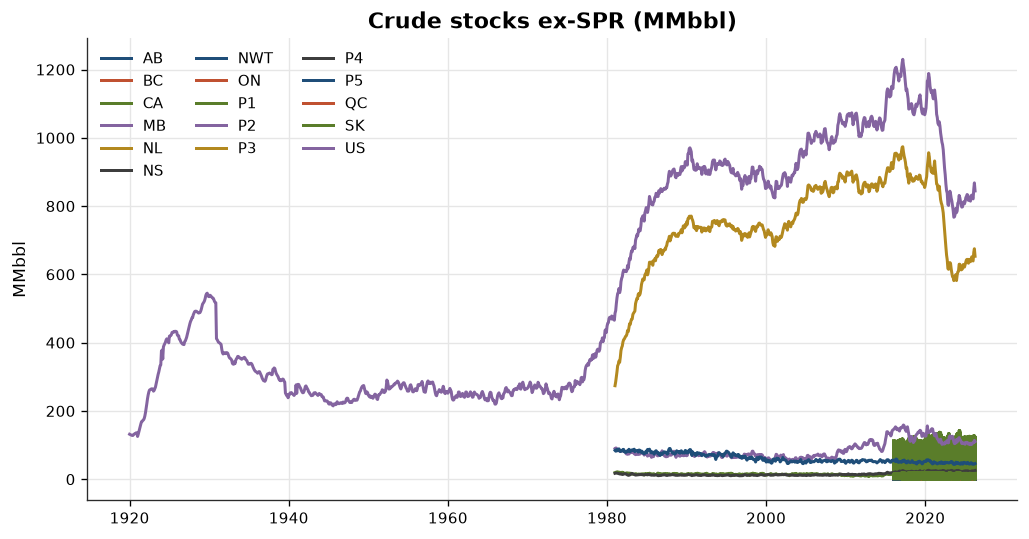
Stocks
Data vintage: AER: 2026-07-06 21:16 UTC; CER: 2026-07-09 17:19 UTC; CNLOPB: 2026-07-12 16:33 UTC; EIA: 2026-07-29 14:29 UTC; EIA_WEEKLY: 2026-07-06 14:26 UTC; FERC: 2026-07-16 19:55 UTC; NDIC: 2026-07-06 19:30 UTC; NM_OCD: 2026-07-06 15:46 UTC; PORTOFCC: 2026-07-08 21:44 UTC; RRC: 2026-07-09 23:42 UTC; RRC_T1: 2026-07-18 15:30 UTC; SASK_ENERGY: 2026-07-11 20:55 UTC; STATCAN: 2026-07-06 20:34 UTC