US Crude Balance — June 2026
Generated 2026-10-09 12:54 UTC. All flows MBBL/D. Bottom-up balance vs EIA published data.
Source freshness
| source | latest_period | lag_months | last_pulled | expected_cadence | expected_next | status |
|---|---|---|---|---|---|---|
| AER | 2026-07-01 | 3 | 2026-09-05 19:54 | monthly | 2026-08-01 | OK |
| CER | 2026-08-18 | 2 | 2026-09-05 19:43 | monthly | 2026-09-18 | OK |
| CER_TOLLS | 2026-05-01 | 5 | 2026-09-24 10:47 | monthly | 2026-06-01 | LATE |
| CNLOPB | 2026-06-01 | 4 | 2026-07-30 02:45 | monthly | 2026-07-01 | LATE |
| EIA | 2026-06-01 | 4 | 2026-09-05 19:36 | monthly | 2026-07-01 | LATE |
| EIA_WEEKLY | 2026-08-28 | 2 | 2026-09-05 19:42 | weekly | 2026-09-04 | LATE |
| FERC | 2026-04-01 | 6 | 2026-10-07 21:49 | annual | 2027-04-01 | OK |
| NDIC | 2026-06-01 | 4 | 2026-09-05 19:53 | monthly | 2026-07-01 | LATE |
| NM_OCD | 2026-06-01 | 4 | 2026-09-05 19:52 | monthly | 2026-07-01 | LATE |
| PORTOFCC | 2026-07-01 | 3 | 2026-09-05 19:53 | monthly | 2026-08-01 | OK |
| RRC | 2026-07-01 | 3 | 2026-10-07 22:42 | monthly | 2026-08-01 | OK |
| RRC_COMPLETIONS | 2026-07-01 | 3 | 2026-07-30 20:20 | monthly | 2026-08-01 | LATE |
| RRC_DRILLING_PERMITS | 2026-07-01 | 3 | 2026-07-30 20:15 | monthly | 2026-08-01 | LATE |
| RRC_PDQ | 2026-08-01 | 2 | 2026-07-30 18:32 | monthly | 2026-09-01 | OK |
| RRC_PENDING_LEASE | 2026-05-01 | 5 | 2026-07-17 18:00 | monthly | 2026-06-01 | LATE |
| RRC_R1 | 2026-06-01 | 4 | 2026-09-08 10:30 | monthly | 2026-07-01 | OK |
| RRC_T1 | 2026-06-01 | 4 | 2026-10-09 12:53 | monthly | 2026-07-01 | OK |
| SASK_ENERGY | 2026-06-01 | 4 | 2026-09-05 19:50 | monthly | 2026-07-01 | LATE |
| STATCAN | 2026-06-01 | 4 | 2026-09-05 19:53 | monthly | 2026-07-01 | LATE |
Headlines
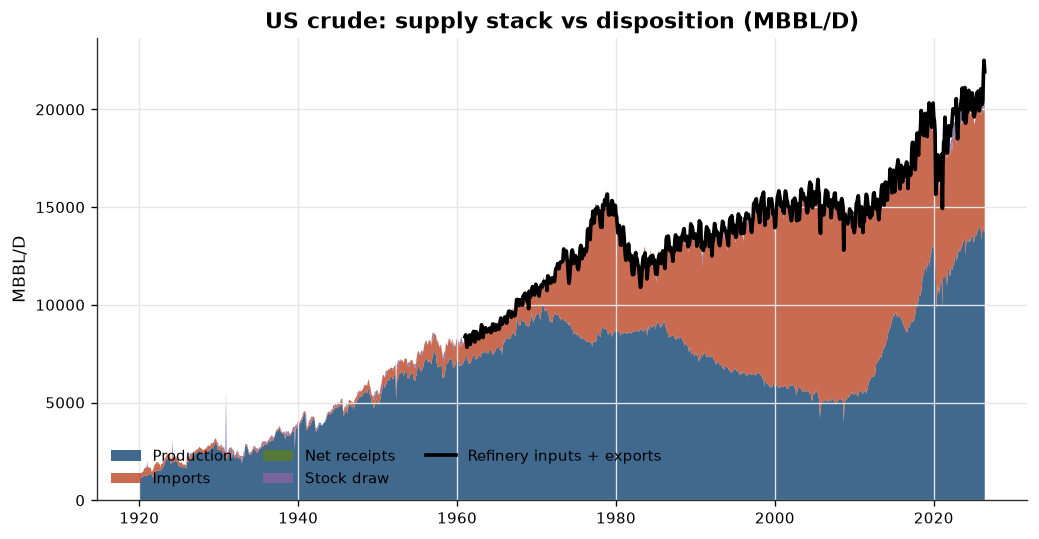
- US residual: -290 MBBL/D.
- Exports down 993 MBBL/D m/m.
- Refinery Inputs up 413 MBBL/D m/m.
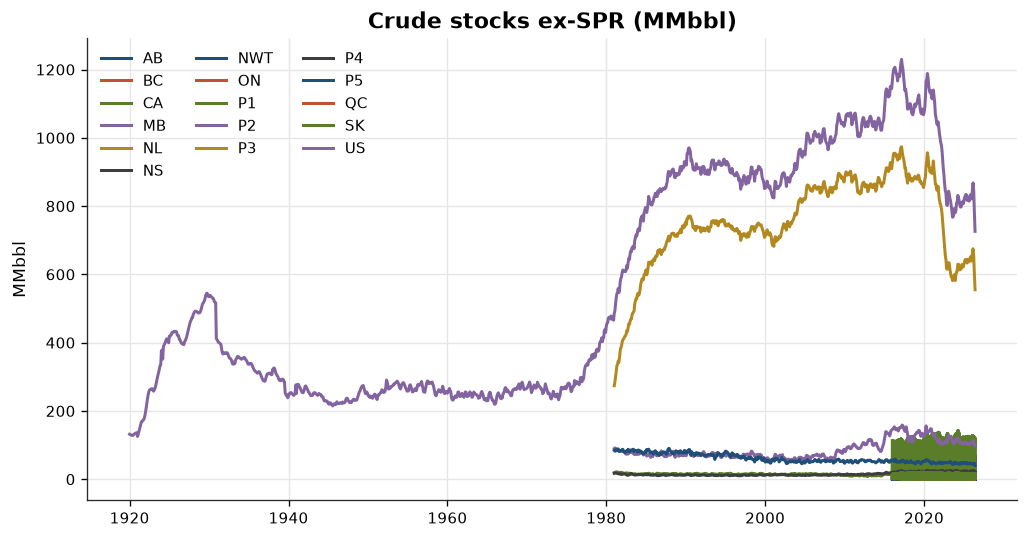
- Stock Draw down 259 MBBL/D m/m.
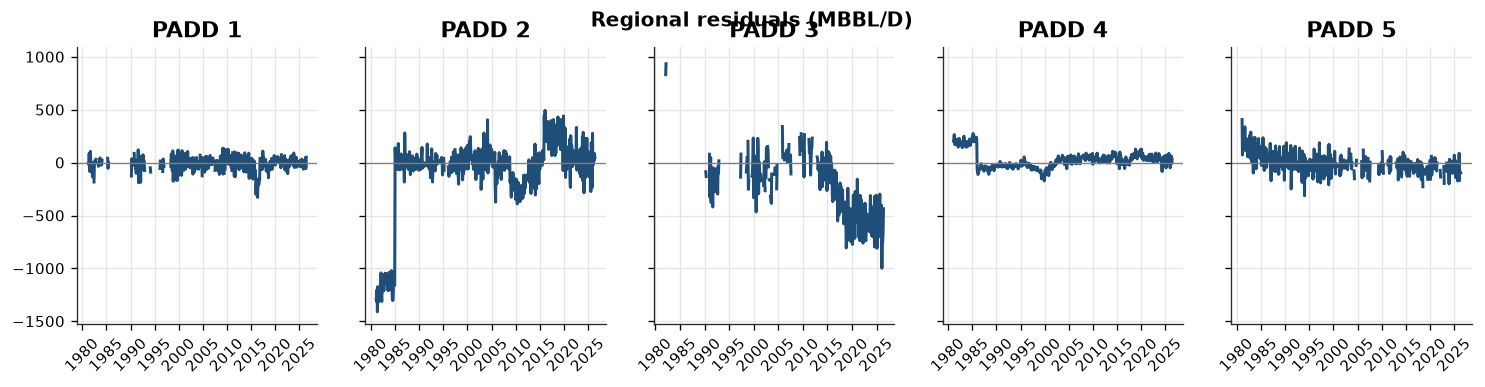
Balance by region
| Region | production | imports | net_receipts | stock_draw | refinery_inputs | exports | exports_basis | residual | spr_stock_draw | residual_incl_spr | transfers_to_supply | residual_incl_transfers | national_terms | residual_incl_national_terms |
|---|---|---|---|---|---|---|---|---|---|---|---|---|---|---|
| US | 13,792 | 6,044 | 0 | 1,809 | 17,200 | 4,735 | REPORTED | -290 | 1,106 | 817 | 570 | 280 | nan | nan |
| P1 | 53 | 529 | 232 | -14 | 727 | 22 | REPORTED | 51 | nan | nan | nan | 51 | nan | nan |
| P2 | 1,822 | 2,886 | -331 | 67 | 4,291 | 105 | REPORTED | 48 | nan | nan | nan | 48 | nan | nan |
| P3 | 10,202 | 1,270 | 748 | 1,477 | 9,525 | 4,608 | REPORTED | -436 | nan | nan | nan | -436 | 290 | -145 |
| P4 | 1,014 | 442 | -829 | 59 | 656 | 0 | P4_ASSUMED_ZERO | 30 | nan | nan | nan | 30 | nan | nan |
| P5 | 700 | 916 | 180 | 221 | 2,000 | nan | NOT_PUBLISHED | nan | nan | nan | nan | nan | nan | nan |
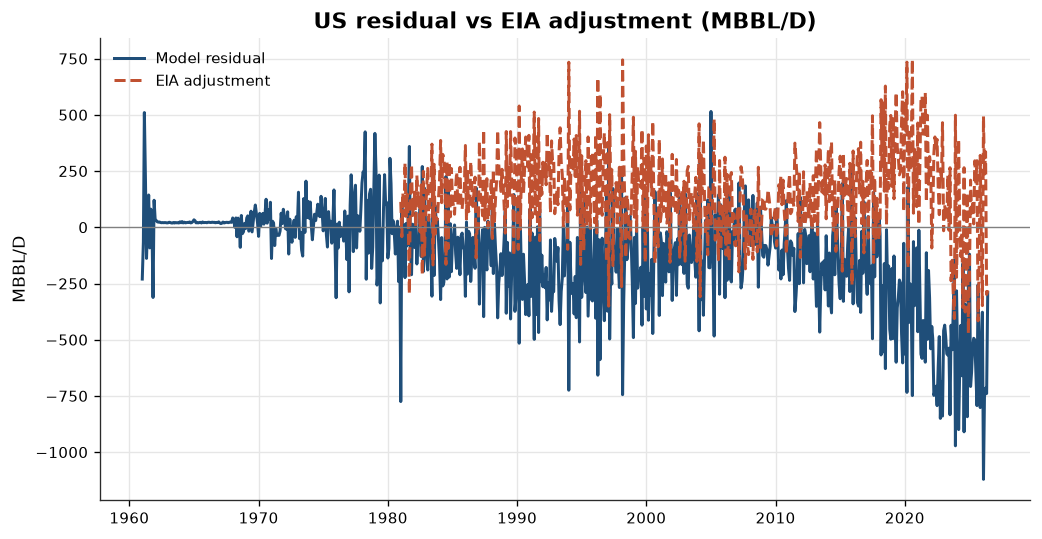
Residual reconciliation vs EIA adjustment (last 12 months)
| period | model_residual | spr_stock_draw | residual_incl_spr | transfers_to_supply | residual_incl_transfers | eia_adjustment | gap | gap_incl_spr | gap_incl_transfers |
|---|---|---|---|---|---|---|---|---|---|
| 2025-07 | -640 | 1 | -639 | 446 | -194 | 195 | -445 | -444 | 1 |
| 2025-08 | -793 | -63 | -856 | 496 | -297 | 297 | -496 | -559 | -0 |
| 2025-09 | -255 | -68 | -323 | 672 | 417 | -416 | -671 | -739 | 1 |
| 2025-10 | -545 | -84 | -629 | 723 | 178 | -178 | -723 | -807 | 0 |
| 2025-11 | -801 | -78 | -879 | 481 | -320 | 320 | -481 | -559 | -0 |
| 2025-12 | -553 | -50 | -603 | 591 | 38 | -36 | -589 | -639 | 2 |
| 2026-01 | -377 | -56 | -434 | 723 | 346 | -348 | -725 | -782 | -2 |
| 2026-02 | -1,120 | -8 | -1,129 | 628 | -492 | 494 | -627 | -635 | 1 |
| 2026-03 | -754 | 20 | -735 | 527 | -227 | 228 | -526 | -506 | 1 |
| 2026-04 | -715 | 677 | -38 | 379 | -336 | 336 | -379 | 298 | 0 |
| 2026-05 | -739 | 1,263 | 524 | 1,037 | 298 | -298 | -1,037 | 225 | -0 |
| 2026-06 | -290 | 1,106 | 817 | 570 | 280 | -280 | -569 | 537 | 1 |
Regional residuals
Stocks
Data vintage: AER: 2026-09-05 19:54 UTC; CER: 2026-09-05 19:43 UTC; CNLOPB: 2026-07-30 02:45 UTC; EIA: 2026-10-07 22:42 UTC; EIA_WEEKLY: 2026-09-05 19:42 UTC; FERC: 2026-10-07 21:49 UTC; NDIC: 2026-09-05 19:53 UTC; NM_OCD: 2026-09-05 19:52 UTC; PORTOFCC: 2026-09-05 19:53 UTC; RRC: 2026-10-07 22:42 UTC; RRC_COMPLETIONS: 2026-07-30 20:20 UTC; RRC_DRILLING_PERMITS: 2026-07-30 20:15 UTC; RRC_PDQ: 2026-07-30 18:32 UTC; RRC_PENDING_LEASE: 2026-07-17 18:00 UTC; RRC_T1: 2026-10-09 12:53 UTC; SASK_ENERGY: 2026-09-05 19:50 UTC; STATCAN: 2026-09-05 19:53 UTC